Statistical Analysis on two groups of neurons
Lmeasure does statistical analysis on two groups of neurons on given metrics (e.g. Diameter, EucDistance, surface area etc.). Two sample student's T test and non parametric Wilcoxon Rank Sum Test are the two available tests.
Steps
To perform statistical test on two groups of neurons one should follow the following steps:
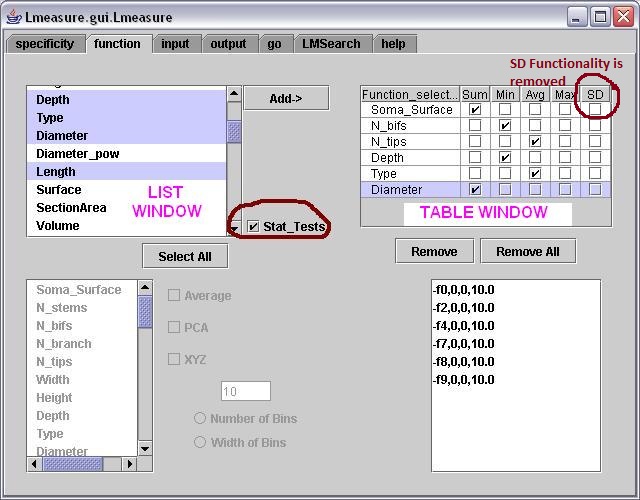
1. In the function panel, Select the checkbox "Stat_Tests" just beside the list window. This will change
the display area on the right to table window with 6 columns namely "function_name",
"Sum","Min","Avg","Max".
2. Select the desired checkbox to perform
statistical test on that particular column (say Average) of the selected metric
(say Surface).
3. Click the "Add" button to add it to the table window or just double click
it.

Fig. 1: Showing how to select different metrics from the list window by selecting the Stat_Tests checkbox. In this example 6 metrics are selected for the statistical analysis.
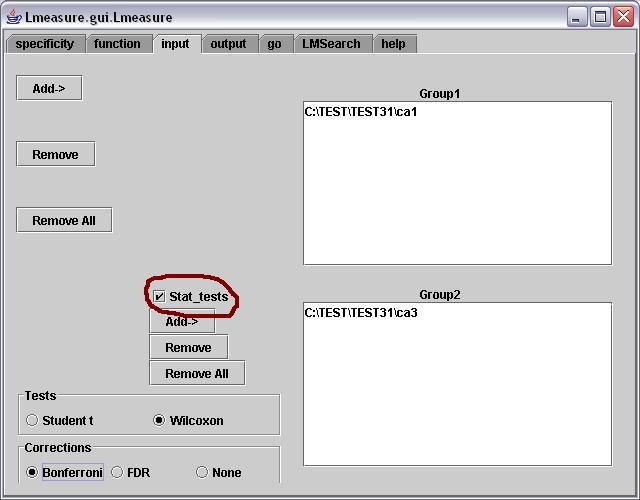
4. Go to the Input panel and select the "Stat_tests" checkbox.
By doing this, Group2 window will be activated.
5. Click on "Add->"
buttons of the Group1 and Group2 respectively to add neuron files to the Group1
and Group2 windows. The 'Remove' and 'RemoveAll' buttons will remove the selected
files from the respective windows.
6. Choose the stat test to be performed.
By default "wilcoxon test" is selected
with no corrections. But you can choose the desired correction and test by selecting
from the radio buttons and checkboxes.
User can input single individual neurons or a groups of neurons (directory) in the two groups. In the below example a directory of neurons is given as the input.

Fig 2: In this example Group1 is given the SWC directory (consists of 3 neurons) and Group2 is also given the SWC directory (consists of 3 neurons). A two group stat test is performed on these two groups of neurons to see if there are any significant differences between the two groups w.r.t the selected morphometrics that are chosen in the function panel.
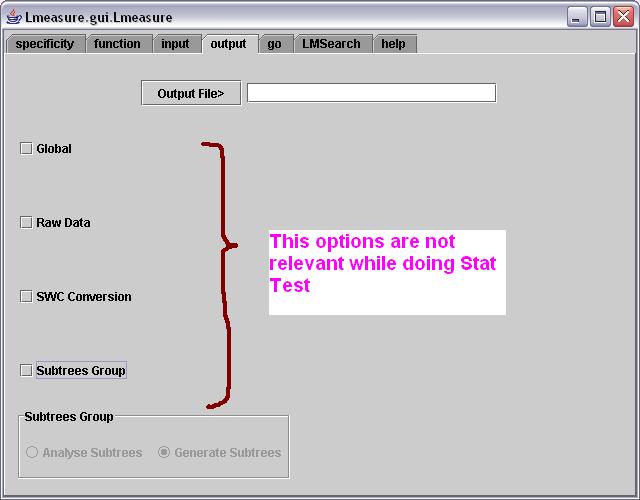
7. Go to Output Panel. This panel is optional. All the checkbox options that are listed in this panel are not relevant for stat tests. However, the user can give the output file name in this panel by clicking on "Output File>" button. A file chooser window helps the user to choose the output file. The output is saved in this file.

Fig 3. In this example the output file is specified so that the output of the stattest is saved in the desired location.
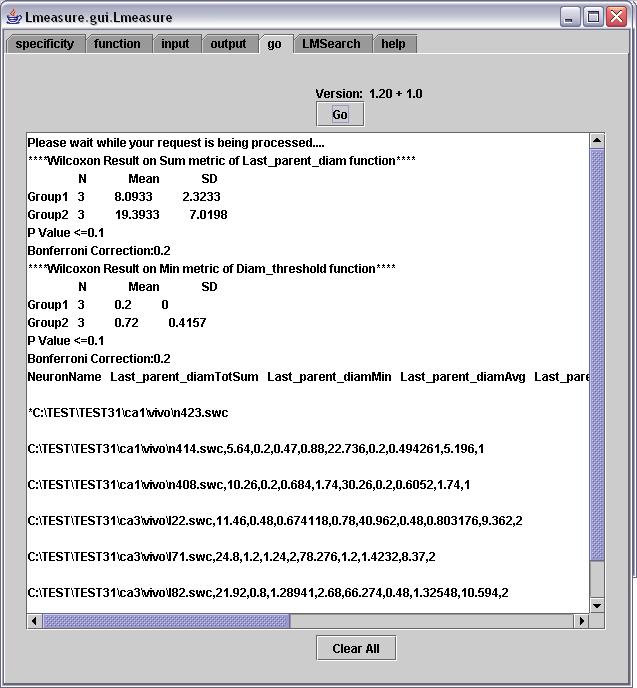
8. Select the Go Panel and click the 'Go' button. The output is displayed in the display area. For each metric selected in the Function Panel the P value and correction values are displayed under the heading of the type of test chosen. A textual message like "Wilcoxon results on Group1 and Group2 datasets on Sum metric of N_branch function" explains how the P value is obtained.

Warning Message
Sometimes you may see the below pop up window, which indicates that there are some missing compartments in the file.Important Notes
When executing locally, for the stat tests, the tool creates a temporary folder on your local machine. For example if you have installed the tool in C:\Lmeasure then it creates a temporary folders like C:\Lmeasure\1117742980344\dir1 and C:\Lmeasure\1117742980344\dir2 this folder is a randomly generated number which is unique for every execution. After the output is displayed the folders are automatically deleted by the tool itself.
If the user doesn't select any output file in the output panel, then the output is saved by default in "Lmout.txt". For e.g. if the current directory is C:\Lmeasure then the output is saved in C:\Lmeasure\Lmout.txt. Along with Lmout.txt other files Lmin.txt (input file) and err.txt (error file) are also created in the same location.
If the output displayed in the Go panel display window is not clear. One can transfer the output file to Excel spread sheet where the column headings and values are clearly shown.