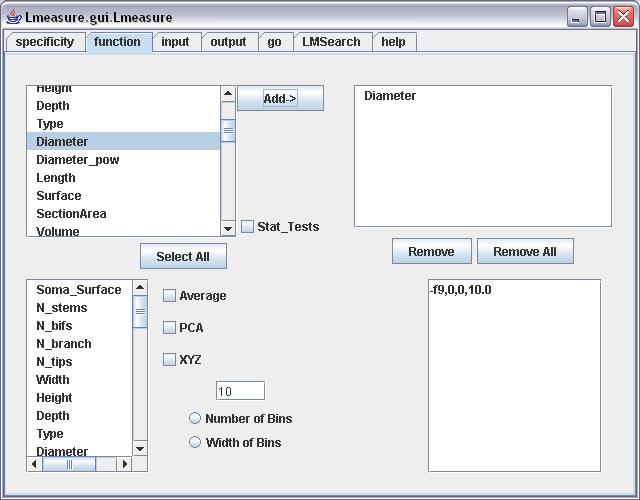
This panel allows you to select one or more morphometric functions to analyze. To select a function, double click on the function name in the list box OR highlight the function and then click the 'Add' button.

Several types of measures can be extracted for each function.
Statistical Summary: Just click on the function you are interested, on the first list, and click Add, as described above. The measure will be returned as sum, minimum, average, maximum, standard deviation, etc. (as exemplified in the list of functions).
Histogram Distribution: Click on the same function name on the two function list, then click Add. The measure will be returned as a histogram (probability density distribution).

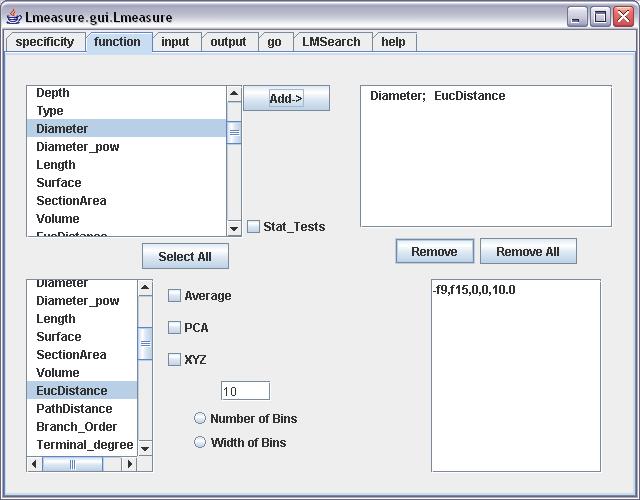
Scatter Distribution: Click on one function from the first list (Function1), and on a different function from the second list (Function2), then click Add. L-Measure will return a series of values of Function1 vs Function2. For example, to extract the dependency of diameter on Euclidian Distance, you need to:
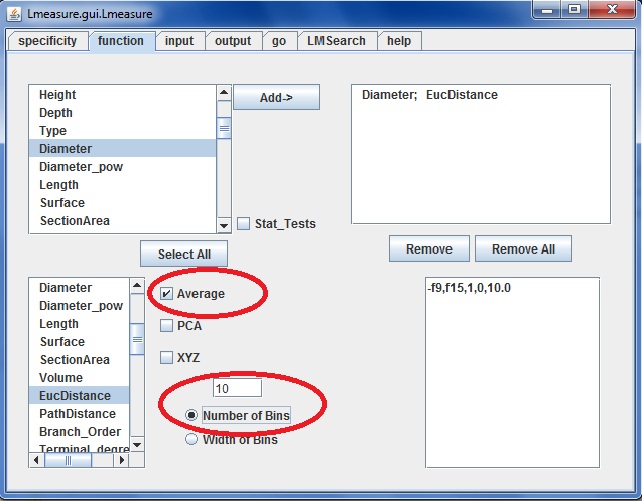
Average/(Tot Sum): If the Average checkbox is checked, the returned scatter distribution data are average values within each bin. If it is not, the data are sum of all values for the given bins.
The Output for Average function looks like this:

Bin Size: There are 2 options to select the bin size. The default method is by the total number of bins: L-Measure computes the range of values of the selected function and uniformly distribute the available bins. This process is computed individually for every neuron and for every function. The second option to select bin size is by specifying the width of the bin (the standard unit being um). L-Measure allows a maximum of 1000 bins for every distribution. If the width is too small, the resulting distribution will contain 1000 bin of which 999 correctly assigned while the last one will contain all remaining values.

Marking the XYZ checkbox (independent of the selected functions) returned a list of 3D coordinates of all compartments that satisfy the Specificity conditions.
Note for advanced users: the bottom right box shows the command line corresponding to the active selection.
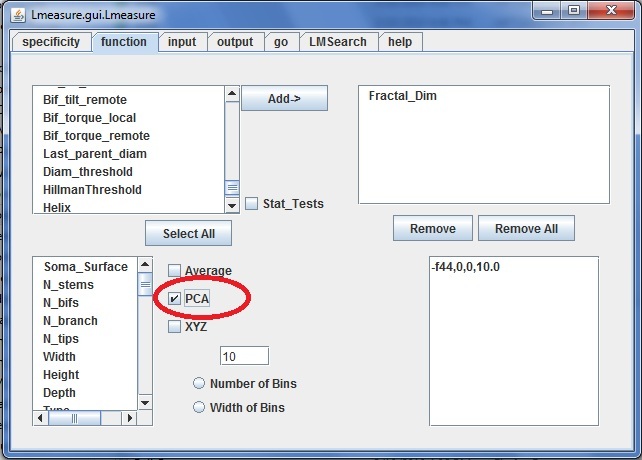
PCA : Principal Component Analysis only applies to 3 morphological functions viz. Height, Width, Depth. It shifts the neuron coordinates to specific location.
Statistical test: Please see how to do stat test manual
Back